Part 8: JIT: Inlining, strength reduction
19 mins readFebruary 28, 2026
java
jit
performance
benchmark
mlp
inlining
loop-unrolling
Hello! Welcome to part 8 of this series. In the last episode we flattened the 4d array which resulted in the increased throughput of ~280 ops/s. In this episode we will continue with few more source code level optimizations and explore some of them done by JIT.
[!warm]
For those who landed here directly, this is the part 8 of the series - Taking JVM on a performance ride (4D tensor). Although not required to read this post, I suggest you to take a look at all the previous posts before reading this.
tl;dr
In this episode we will learn about optimizations done by JIT like inlining, unrolling, strength reduction. We will also learn about a specfic case how loop unrolling turned out to be bad for us.
Baseline (from previous episode)
Here it’s for quick reference
$ java -jar target/benchmarks.jar -wi 2 -i 2 -r 5s
Picked up _JAVA_OPTIONS: -XX:+AlwaysPreTouch -Xmx2G -Xms2G -XX:+UseLargePages -XX:+UseTransparentHugePages -XX:LargePageSizeInBytes=2M
...
Benchmark                      Mode  Cnt    Score   Error  Units
Tensor4DBenchmark.accessTest  thrpt    2  284.865          ops/s
Introduction of two new methods
In this episode we introduce a new method named set which allows us to set an element of a tensor element. Since both get and set need index calculation, we are going refactor them and introduce one more method named index.
They look like follows
int index(int b, int ch, int r, int c) {
    return 0
        + b  * (chDim * rDim * cDim)
        + ch * (rDim * cDim)
        + r  * (cDim)
        + c;
}

public float get(int b, int ch, int r, int c) {
    return arr[index(b, ch, r, c)];
}

public void set(int b, int ch, int r, int c, float val) {
    arr[index(b, ch, r, c)] = val;
}
Some obvious optimizations
Our code lacks some very obvious optimizations such as -
Inlined computation of index calculation in get method
Method calls require some setup instructions like saving register values due to calling conventions, setup argument registers, checking stack etc, setting up stack, copying return values etc. This costs few cycles. If we copy this calculation to get and set methods, the resulting code will be much faster.
But there are some other costs here
- Maintainability of code - Since we don’t have macros in Java, we may soon endup copying index calculation code to every method. Every update to index calculation code (unlikely but possible) needs updating many methods.
- Increase in method size
Compilers already solve this by automatic inlining (replace the function calls with the function code itself) of small methods. Languages like C++ even provide a keyword to let programmer hint the compiler to inline a method.
Pre-compute the strides
Some of calculations in the index method like (chDim * rDim * cDim) can be pre-computed to avoid re-computation on every index calculation.
Before doing these optimizations, let’s look at what code JIT has generated.
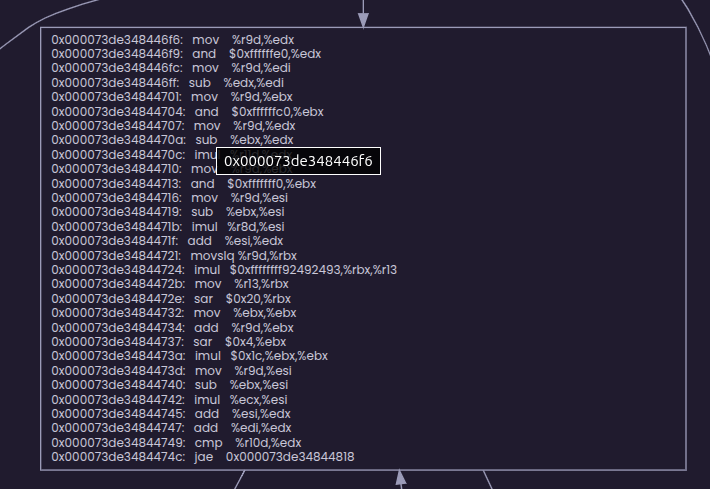
Looking at the generated code
In episode 2 we found out how to print the assembly generated by JIT. It was tedious to read, so I wrote a JS app named asm-vis to show the CFG (you can embed this in your pages too).
Let’s use this and look at the generated asm (you can go full screen and zoom / pan the graph and read the code).
Notice this block. JIT has already added the precomputation for us.
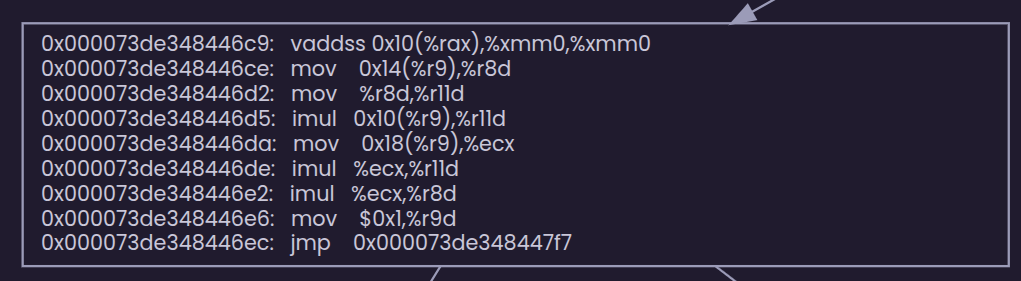
If you look further down, in the large blocks, there are no calls to get or index methods, so JIT has inlined them too.
But what about mutability of bDim, rDim …?
What if values of bDim, rDim, chDim and cDim are expected to change mid execution of our benchmark (hypothetically). JIT doesn’t seem to care about mutability of these variables.
This is because Java memory model specification doesn’t guarantee implicit inter-thread synchronization, so JIT has the freedom to let these pre-computations happen. But this may not always be true, if no registers are available for caching precomputed value, JIT may generate code to recompute these everytime.
Since there is no guarantee of this behavior, in few cases our program may not behave as expected. To make this optimization explicit, we can tell the JIT that the computation like (chDim * rDim * cDim) are constants and it’s safe to inline them. This can be done by marking the fields bDim, chDim, rDim, cDim as final.
Side note: Can we observe / control inlining?
Java provides an option (-XX:+PrintInlining) observe the inlining it carries out by printing them to stdour. This option has to be unlocked by using the option -XX:+UnlockDiagnosticVMOptions. Here is a sample from my benchmark runs.
@ 45   com.mpataki.Tensor4D::get (15 bytes)   inline (hot)
    @ 10   com.mpataki.Tensor4D::index (41 bytes)   inline (hot)
There were some examples which tell us why some method was not inlined like
// can't inline native methods
@ 11   java.lang.Object::clone (0 bytes)   failed to inline: native method

// can't inline large methods
@ 46   jdk.internal.classfile.impl.EntryMap::nextToken (37 bytes)   failed to inline: too big
Inlining sounds fantastic, but it comes with some cost. If the size of the inlined method is far larger than the method setup OR caller is barely invoked, inlining bloats the caller code and wastes memory. But if not done, cycles go wasted for smaller methods. Also, compiler can’t be directly influenced to do inlining from java code as we can do in C++ (not kidding 😝).
So java has cost model (implemented as rules (source)) with few knobs to tune inlining.
A method will be inlined if
- If specified to inline via compile command (see below section)
- If specified to inline via annotation (see below section)
- Depending on how many throws are present and how much the code size is
- The number of throws should be less than
- Compiled size is smaller than
-XX:FreqInlineSize=intbytes and below two conditions match- frequency of invocation of callee from same call site thru interpreter
- Can be controlled by
-XX:InlineFrequencyRatio=<double> - Can be traced by
-XX:+TraceFrequencyInlining(outputs like below)Inlined frequent method (freq=148150.000000): <ciMethod name=accum holder=test signature=(I)V loaded=true arg_size=2 flags=DEFAULT_ACCESS ident=1361 address=0x00007863c4172a58>
- Can be controlled by
- Escape analysis is turned on and callee is a constructor or returns an iterator.
- Escape analysis : Analysis done to do some optimizations for allocation like skipping [heap] allocation / scalar replacement / lock elimination when a object created doesn’t escape method or thread boundaries. Can be controlled by
-XX:+DoEscapeAnalysis-XX:+PrintEscapeAnalysis- available in debug versions of java
- Escape analysis : Analysis done to do some optimizations for allocation like skipping [heap] allocation / scalar replacement / lock elimination when a object created doesn’t escape method or thread boundaries. Can be controlled by
- frequency of invocation of callee from same call site thru interpreter
- Compiled size (in bytes) is smaller than max inline size
-XX:MaxInlineSize=int
It won’t be inlined if
- Invocation count is 0
- native method
- don’t inline annotation (see below)
- method changes Thread.currentThread
- has unloaded classes mentioned signatures
- invocation frequency is less that
-XX:MinInlineFrequencyRatio
Fine control: Annotations, Compile commands
JVM honors annotations like ForceInline, DontInline for privileged code (trusted code like JDK classes). These annotations are present in the jdk.internal.vm.annotation package. Here is how to use it
import jdk.internal.vm.annotation.*;

class test {
    int sum = 0;

    @DontInline
    void accum(int i) {
        sum += i;
    }

    void run() {
        for(int i=0; i<1000000; i++)
            accum(i);
    }

    public static void main(String a[]) {
        new test().run();
    }
}
If you just compile (well you can’t simply compile this as well) this class and run it, JVM will silently ignore your annotation (it’s not you, it’s untrusted code 😅). So you need to add this code to trusted code list. Here is how you do it
$ javac \
    --add-exports java.base/jdk.internal.vm.annotation=ALL-UNNAMED  \
    test.java

# adding to bootclasspath make the code trusted
$ java  \
    --add-exports java.base/jdk.internal.vm.annotation=ALL-UNNAMED  \
    -XX:+UnlockDiagnosticVMOptions -XX:+PrintInlining               \
    -Xbootclasspath/a:.                                             \
    test | grep test
    ...
            @ 10   test::accum (11 bytes)   failed to inline: don't inline by annotation
            @ 10   test::accum (11 bytes)   failed to inline: don't inline by annotation
Thru compile commands
You can even pass compile commands via command line
java -XX:CompileCommand=inline,com.mpataki.Tensor4DBenchmark::realTest ...
java -XX:CompileCommand=dontinline,com.mpataki.Tensor4D::get ...
What if inlining was disabled for index and get?
Here are the results. You see, we achieved 2.8x throughput without doing any changes to our code by just relying on JIT.
$ java  \
    -XX:CompileCommand=dontinline,com.mpataki.Tensor4D::index \
    -XX:CompileCommand=dontinline,com.mpataki.Tensor4D::get \
    -jar target/benchmarks.jar -wi 0 -i 1 -f 1 -r 5s
...
# Run progress: 0.00% complete, ETA 00:00:10
# Warmup Fork: 1 of 1
Iteration   1: 101.721 ops/s

# Run progress: 50.00% complete, ETA 00:00:07
# Fork: 1 of 1
Iteration   1: 101.607 ops/s

Benchmark                      Mode  Cnt    Score   Error  Units
Tensor4DBenchmark.accessTest  thrpt       101.607          ops/s
Other optimizations
If you are a careful reader, you might have already noticed that JIT has done a loop unrolling for us. It’s has unrolled the loop twice for us. If you have enough patience, sit with a pen and paper and trace the assembly generated. You might chuckle on the optimizations JIT made for you. Any way here they are
Replacing % with logical AND (strength reduction)
We had below code in our benchmark
b = i % B_DIM
ch = i % CH_DIM
c = i % C_DIM
Which is now replaced by (since B_DIM, CH_DIM, C_DIM are powers of 2)
b = i - (i & ~B_DIM)
ch = i - (i & ~CH_DIM)
c = i - (i & ~C_DIM)
This is called strength reduction where instructions which requires a lot of cycles (strong) are replaced by weaker equvivalent instructions. The transformation done for r = i % R_DIM is something I haven’t wrapped my head around. It has some math in it which I am not planning to explore right now.
How much improvement do you think this optimization can bring us? To check this, let’s change our benchmark code to create a tensor of shape with no powers of 2. Here is the code and the results (I’ve used prime numbers which are around original numbers).
// total size = 932263 * 4 bytes compared to original 917504 bytes
final int B_DIM = 61;
final int CH_DIM = 17;
final int R_DIM = 29;
final int C_DIM = 31;

Tensor4D tensor = new Tensor4D(B_DIM, CH_DIM, R_DIM, C_DIM);

public float realTest() {
    float sum = 0;
    for (int i = 0; i < 1_000_000; i++) {
        int b = i % B_DIM,
            ch = i % CH_DIM,
            r = i % R_DIM,
            c = i % C_DIM;
        sum += tensor.get(b, ch, r, c);
    }
    return sum;
}
results
$ java -jar target/benchmarks.jar -wi 2 -i 2 -r 5s
Picked up _JAVA_OPTIONS: -XX:+AlwaysPreTouch -Xmx2G -Xms2G -XX:+UseLargePages -XX:+UseTransparentHugePages -XX:LargePageSizeInBytes=2M
...
# Warmup Iteration   1: 154.965 ops/s
# Warmup Iteration   2: 155.521 ops/s
Iteration   1: 155.712 ops/s
Iteration   2: 155.592 ops/s

# Warmup Iteration   1: 132.908 ops/s
# Warmup Iteration   2: 147.923 ops/s
Iteration   1: 139.110 ops/s
Iteration   2: 147.978 ops/s

Benchmark                      Mode  Cnt    Score   Error  Units
Tensor4DBenchmark.accessTest  thrpt    2  143.544          ops/s
Are you smart?
Just pokin’ you 😎 … One can argue that for powers of two, JIT could have simply generated the below code. But it wouldn’t do that because i might be negative and we won’t get correct results in that case (😠 java has no unsigned)
b = i & (B_DIM - 1)
ch = i & (CH_DIM - 1)
c = i & (C_DIM - 1)

// notes:
// 1. why (x - 1), because 16 (base 10) = 10000 (base 2), so 01111 (base 2) = 15 (base 10) = 16 - 1 (base 10)
// 2. why we need to &? you have come this far, i know you'll find out!
// 3. (x - 1) is a constant and can be cached
What is this & and ~ here?
Since bDim (64), chDim (16), cDim (32) are all powers of 2, computing remainder of a division when these numbers are the divisors becomes extremely easy. This is similar to how easy it’s to find the remainder when divisor is powers of 10 and numbers are represented in decimal.
Example of division by powers of 10
763467 % 100 = 763467 % (10^2) = last 2 digits 20000412 % 10000 = 20000412 % (10^4) = last 4 digits
Similarly when numbers are represented in binary and divisor is of form 2^s, remainder is number formed by just lower x digits. This can be computed simply by anding the dividend with a string of x 1s.
Computing a string of x 1s can be done by a bit hack - 2^x - 1 (because all bits have to flip to form a number which has only one 1 in its most significant bit)
But we can’t use this because java’s remainder has to work with -ve numbers as well, so Java generates code as any normal division would work
remainder = dividend - (quotient * divisor)
Dividing by a 2^x is also a bit hack, you just need to erase last x bits from the number. This can be done by ANDing with ~(divisor - 1) which flips all the bits.
How does this matter?
Division and multiplication are extremely slow operations even the current CPUs and require a lot more cycles (~40). But the bit hacks mentioned above finish in a handful of cycles. So compilers aggressively try to remove such costly operations
How much thruput do you think this optimization would bring, if we manually do it? Let’s see, below is the benchmark code
public float realTest() {
    float sum = 0;
    for (int i = 0; i < 1_000_000; i++) {
        int b = i & (B_DIM - 1),
            ch = i & (CH_DIM - 1),
            r = i % R_DIM,
            c = i & (C_DIM - 1);
        sum += tensor.get(b, ch, r, c);
    }
    return sum;
}
$ java -jar target/benchmarks.jar -wi 2 -i 2 -r 5s
Picked up _JAVA_OPTIONS: -XX:+AlwaysPreTouch -Xmx2G -Xms2G -XX:+UseLargePages -XX:+UseTransparentHugePages -XX:LargePageSizeInBytes=2M
...
# Warmup Iteration   1: 323.549 ops/s
# Warmup Iteration   2: 326.014 ops/s
Iteration   1: 327.696 ops/s
Iteration   2: 330.487 ops/s

# Warmup Iteration   1: 324.220 ops/s
# Warmup Iteration   2: 326.191 ops/s
Iteration   1: 327.074 ops/s
Iteration   2: 328.081 ops/s

Benchmark                      Mode  Cnt    Score   Error  Units
Tensor4DBenchmark.accessTest  thrpt    2  327.578          ops/s
Wow! That’s a 15% improvement!
Conclusion
In this episode we
- were hoping to do some optimizations like inlining and pre-computations and noted JIT had already performed them.
- learnt about strength reduction and knobs to tune the inlining.
- noticed that by a little bit-hacking we can workaround the Java’s limitation of not having unsigned types.
In the next episode (hopefully on Sunday), we will see further optimizations and a experiment where over-optimization brought down the throughput. Until then, Chao!