Part 7: Java array layout and 60% perf. gain
11 mins readFebruary 28, 2026
linux
performance
benchmark
tlb
cache
memory
java
Hello! Welcome to part 7 of this series. In this episode we will continue to look at the memory latencies and improve the performance even further.
[!warm]
For those who landed here directly, this is the part 7 of the series - Taking JVM on a performance ride (4D tensor). I suggest you to take a look at all the previous posts before reading this.
tl;dr
Multi-dimensional Java arrays introduce pointer indirection and scattered memory access. Flattening the data into a contiguous 1D structure improved spatial locality, reduced TLB pressure, and yielded ~60% performance improvement in a memory-bound benchmark.
In the last episode we tried to reduce the TLB misses by increasing the page size and the misses came down to ~2M. Can we do better? But before we dive in, I wanted to call out something.
Error in our measurements
Until now we have been looking at perf counters for the whole Java appplication and not just the benchmark, so our readings are not accurate. To solve this JMH provides a way to get the counters only for our benchmark code. This can be done using -prof option in the JMH. There are a lot of type of profilers, but we will use the normalized perf (perfnorm) for our case as this gives per benchmark-call statitics.
Here is one run of the benchmark with this profiler (full output).
$ taskset -c 10-11 java -jar target/benchmarks.jar -prof perfnorm -wi 2 -i 2
...
Benchmark                                            Mode  Cnt         Score   Error      Units
Tensor4DBenchmark.accessTest                        thrpt    2       133.263              ops/s
Tensor4DBenchmark.accessTest:CPI                    thrpt              0.358          clks/insn
Tensor4DBenchmark.accessTest:IPC                    thrpt              2.794          insns/clk
Tensor4DBenchmark.accessTest:L1-dcache-load-misses  thrpt        2398891.680               #/op
Tensor4DBenchmark.accessTest:L1-dcache-loads        thrpt        7019438.903               #/op
Tensor4DBenchmark.accessTest:L1-dcache-stores       thrpt          11913.478               #/op
Tensor4DBenchmark.accessTest:L1-icache-load-misses  thrpt           4562.458               #/op
Tensor4DBenchmark.accessTest:LLC-load-misses        thrpt            151.708               #/op
Tensor4DBenchmark.accessTest:LLC-loads              thrpt          67594.351               #/op
Tensor4DBenchmark.accessTest:LLC-store-misses       thrpt              7.467               #/op
Tensor4DBenchmark.accessTest:LLC-stores             thrpt            320.958               #/op
Tensor4DBenchmark.accessTest:branch-misses          thrpt           1227.786               #/op
Tensor4DBenchmark.accessTest:branches               thrpt        5014496.884               #/op
Tensor4DBenchmark.accessTest:cycles                 thrpt       19358718.240               #/op
Tensor4DBenchmark.accessTest:dTLB-load-misses       thrpt             26.433               #/op
Tensor4DBenchmark.accessTest:dTLB-loads             thrpt        7019772.999               #/op
Tensor4DBenchmark.accessTest:dTLB-store-misses      thrpt              7.915               #/op
Tensor4DBenchmark.accessTest:dTLB-stores            thrpt          11076.570               #/op
Tensor4DBenchmark.accessTest:iTLB-load-misses       thrpt              8.799               #/op
Tensor4DBenchmark.accessTest:iTLB-loads             thrpt             25.510               #/op
Tensor4DBenchmark.accessTest:instructions           thrpt       54094393.720               #/op
Notice the counters for L1-dcache-load-misses, LLC-load-misses (last level cache), branches and misses, dTLB-load-misses in above output.
Predicting the ideal limit for above counters
Before we try to optimize any further, we need to evaluate what is the best we can do. For this we need to clearly understand the application to the lowest level.
- Our application simply accesses elements from a 4D array at pseudo random locations (they are not actually pseudo random, check this simulation).
- This 4D array is present in heap
- Its size is
64 x 16 x 28 x 32 x 4 bytes (per float) = 3670016 bytes ~= 3MB(Please read ahead)- This can’t fit in to a 2MB page. So it will span atmost 3 pages in a 2MB huge-page system.
- Adds these elements to a a variable
- Present in stack
- Call a blackhole.consume method
Assuming our benchmark method & blackhole.consume’s code is at max a KB and in worst case the blackhole.consume’s method code lies in a different page, the code executed should fall in at most 4 pages.
So these should be our upper bounds
TLB misses
We should be seeing ~8 TLB misses. Why?
- 3 dTLB misses for array access
- 1 dTLB miss for stack access
- 4 iTLB misses for code
Cache misses
I don’t have a quick formulae for this because our access pattern is quite unique. So I tried to simulate and count for the worst case cache using a cache simulator I wrote. Here is what it predicts for a core (with zero other load) with below L1 cache
- size 64KB
- 4 way (round robin way-selection for new loads) set associative cache
- 64byte wide
$ python cache_simulator.py --size 65536 --ways 4 --width 64
accesses = 1000000
misses   = 448 (0.0448%)
hits     = 999552 (99.9552%)
Note that our current dcache misses are off by orders of magnitude.
Visualizing the access pattern and cache behavior
I tried to simulate the access pattern and cache using a webpage generated by Antigravity (Opus 4.6). You should definitely check this - cache simulation
The problem: Java’s multidimensional array layout
Above section built the ideal upper bounds based on an assumption “arrays are contiguous”. But Java’s multidimensional arrays are not! They are laid out as below. In a \(n\) dimensional array all \(n-1\) dimensions store pointer to arrays in next level.
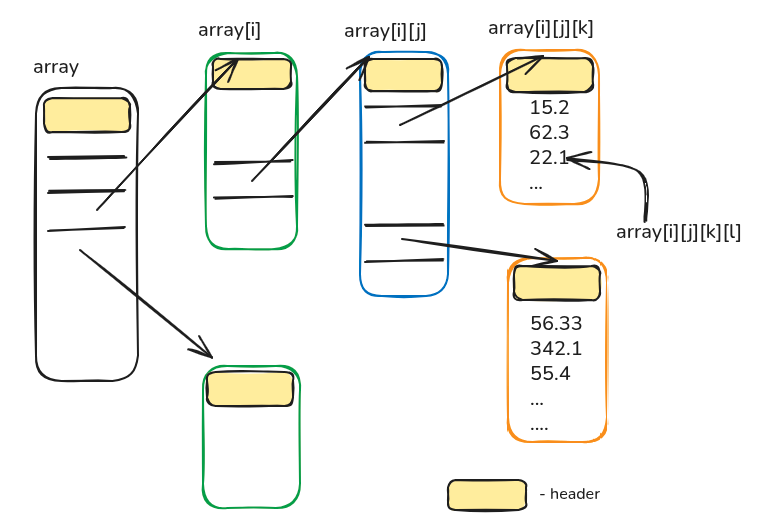
This layout going to be catastrophic for our application for three reasons
-
Accessing an element in such multidimensional array requires pointer chasing (remeber the code generated by JIT), if arrays at different levels are spread accross pages (which is more possible), there will be more TLB misses
-
A single element access requires dereferencing 4 pointers which boil down to 4 extra memory accesses each time.
-
Size of the array increases. The exact size of a \(N\)-dimensional array with shape \((a_1, a_2, \dots, a_N)\) will be (assuming compressed pointers)
\[\text{size} = \left( a_1 + a_1 a_2 + a_1 a_2 a_3 + \dots + a_1 a_2 \dots a_{N-1} \right) \times 4 \;+\; \left( a_1 a_2 \dots a_N \right) \times size\_of\_element\]For our example it will be
\[\begin{aligned} \text{size} &= (64 + 64 \cdot 16 + 64 \cdot 16 \cdot 28)\cdot 4 \\ &\quad + (64 \cdot 16 \cdot 28 \cdot 32)\cdot 4 \\ &= 3{,}789{,}056 \end{aligned}\]
What next?
Languages like C, C++ store the multidimensional arrays in a flat structure. During indexed element access, compiler generates the code to convert the user’s multidimensional index to a flat index (Note that compiler is aware of the array size). We can borrow the same idea and implement for our tensor.
Introducing Tensor4D class
I enumerated the above idea in a class named Tensor4D. To test whether it works, you can run the Tensor4DTest test.
public class Tensor4D {

    float arr[];
    int bDim, chDim, rDim, cDim;

    public Tensor4D(int bDim, int chDim, int rDim, int cDim) {
        this.bDim = bDim;
        this.chDim = chDim;
        this.rDim = rDim;
        this.cDim = cDim;
        this.arr = new float[bDim * chDim * rDim * cDim];
    }

    public float get(int b, int ch, int r, int c) {
        return arr[
            0                               // here for aesthetics
            + b  * (chDim * rDim * cDim)    // skip b blocks
            + ch * (rDim * cDim)            // skip ch channels
            + r  * (cDim)                   // skip r rows
            + c                             // skip c columns
        ];
    }
}
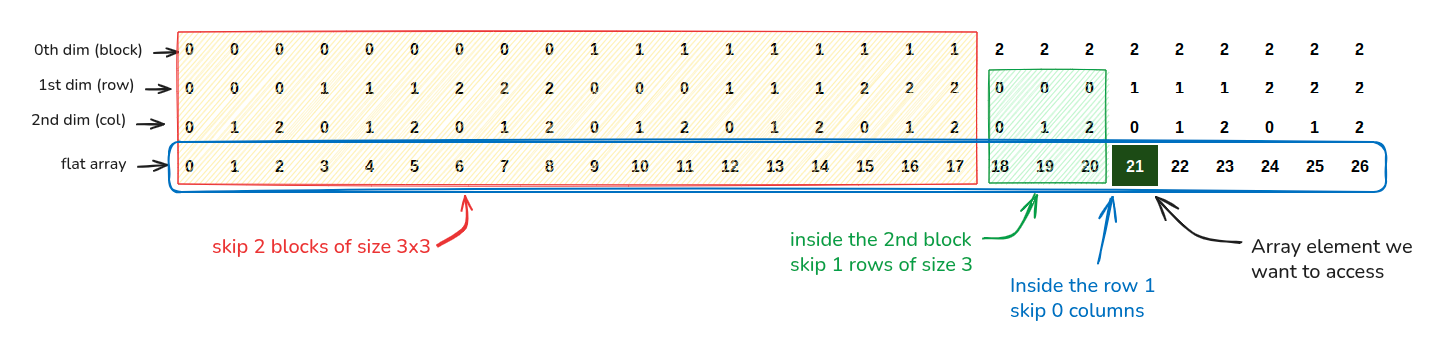
To understand what calculations are done in get, look at this diagram where we are accessing the element at (2, 1, 0) in a 3d array of shape (3, 3, 3)
Get this code
Code and results referred here are present in p7-single-d-array branch of mmpataki/tensor.benchmark, you can get them and reproduce the results on your computer by -
# clone the repo, cd & pull
$ git clone https://github.com/mmpataki/tensor.benchmark; cd tensor.benchmark; git pull

# checkout the branch used for this part
$ git checkout p7-single-d-array

# build the benchmark
$ mvn clean package
The 60% performance gain
Here is the run of the benchmark using the Tensor4D class (full output). Notice we hit 287 ops/s which is 60% improvement over our earlier ~140 ops/s.
$ taskset -c 10-11 java -jar target/benchmarks.jar -prof perfnorm -wi 2 -i 2
...
Benchmark                                            Mode  Cnt         Score   Error      Units
Tensor4DBenchmark.accessTest                        thrpt    2       287.630              ops/s
Tensor4DBenchmark.accessTest:CPI                    thrpt              0.252          clks/insn
Tensor4DBenchmark.accessTest:IPC                    thrpt              3.962          insns/clk
Tensor4DBenchmark.accessTest:L1-dcache-load-misses  thrpt           7309.383               #/op
Tensor4DBenchmark.accessTest:L1-dcache-loads        thrpt        1008458.441               #/op
Tensor4DBenchmark.accessTest:L1-dcache-stores       thrpt           5928.029               #/op
Tensor4DBenchmark.accessTest:L1-icache-load-misses  thrpt           2100.949               #/op
Tensor4DBenchmark.accessTest:LLC-load-misses        thrpt             34.797               #/op
Tensor4DBenchmark.accessTest:LLC-loads              thrpt            319.140               #/op
Tensor4DBenchmark.accessTest:LLC-store-misses       thrpt              5.777               #/op
Tensor4DBenchmark.accessTest:LLC-stores             thrpt            119.419               #/op
Tensor4DBenchmark.accessTest:branch-misses          thrpt            667.397               #/op
Tensor4DBenchmark.accessTest:branches               thrpt        1506185.433               #/op
Tensor4DBenchmark.accessTest:cycles                 thrpt        8970497.486               #/op
Tensor4DBenchmark.accessTest:dTLB-load-misses       thrpt              6.784               #/op
Tensor4DBenchmark.accessTest:dTLB-loads             thrpt        1009581.692               #/op
Tensor4DBenchmark.accessTest:dTLB-store-misses      thrpt              6.364               #/op
Tensor4DBenchmark.accessTest:dTLB-stores            thrpt           4877.616               #/op
Tensor4DBenchmark.accessTest:iTLB-load-misses       thrpt              5.646               #/op
Tensor4DBenchmark.accessTest:iTLB-loads             thrpt              8.516               #/op
Tensor4DBenchmark.accessTest:instructions           thrpt       35544485.004               #/op
Concluding remarks
- Java’s default multi-dimensional arrays can impose pointer chasing and scatter data across pages
- Flat memory layouts drastically reduce the pointer overload in memory bound applications and unlock significant performance gains
Although I am happy with the TLB miss rate matching what we predicted and branch misprediction rate coming down as a side effect, I am not happy with the L1 dcache misses, there is something either wrong in measurement / interpreation / side effect by profiling. We will try to dig deeper in this in the next episode.
Until then, stare at this code generated by the C2 compiler and find whether there is something we can do here.