Part 2: JIT disassembly, compressed oops and task pinning in Linux
14 mins readDecember 30, 2025
java
jvm
performance
jit
benchmark
Hello!! Welcome back!
For those who landed here directly, this is the part 2 of the series - Taking JVM on a performance ride (4D tensor). I suggest you to take a look at the intro page before reading this.
Code and results referred here are present in mmpataki/tensor.benchmark, you can get them and reproduce the results on your computer by -
# clone the repo, cd & pull
$ git clone https://github.com/mmpataki/tensor.benchmark; cd tensor.benchmark; git pull

# checkout the branch used for this part
$ git checkout p2-java-assembly-and-task-pinning

# build the benchmark
$ mvn clean package
In this part, we will check the code generated by the JIT compiler and try some optimizations based on that. JVM can print the binary code generated by these compilers using a disassembler plugin named hsdis. You can download it from internet or build on your own (Steps at the end)
Once you have hsdis in place, asking the JVM to disassemble and print the assembly is just adding a cmdline option.
java \
    -XX:+UnlockDiagnosticVMOptions \
    -XX:CompileCommand=print,com.mpataki.Tensor4DBenchmark::realTest \
    -jar target/benchmarks.jar
Compiler output from my machine are here
Reading the assembly
The assembly is too large to read in the raw format (too many brnaches), so with the help of ChatGPT I created a python script which will render it as a graph. The script can be found here. To use it, run the below command and paste the output in GraphViz online
cat c2-compiled-realTest.S | python asm_cfg.py
OR
You can see the complete graph here - Control-Flow-Graph-of-generated-assembly
For curious readers - the generated assembly has too much of validation and error handling, you can take help of ChatGPT to understand it. I was really surprised when it asked me whether this was generated by JVM without even providing comments.
In this big CFG, the hotspot (our array access code) is the below sub graph.
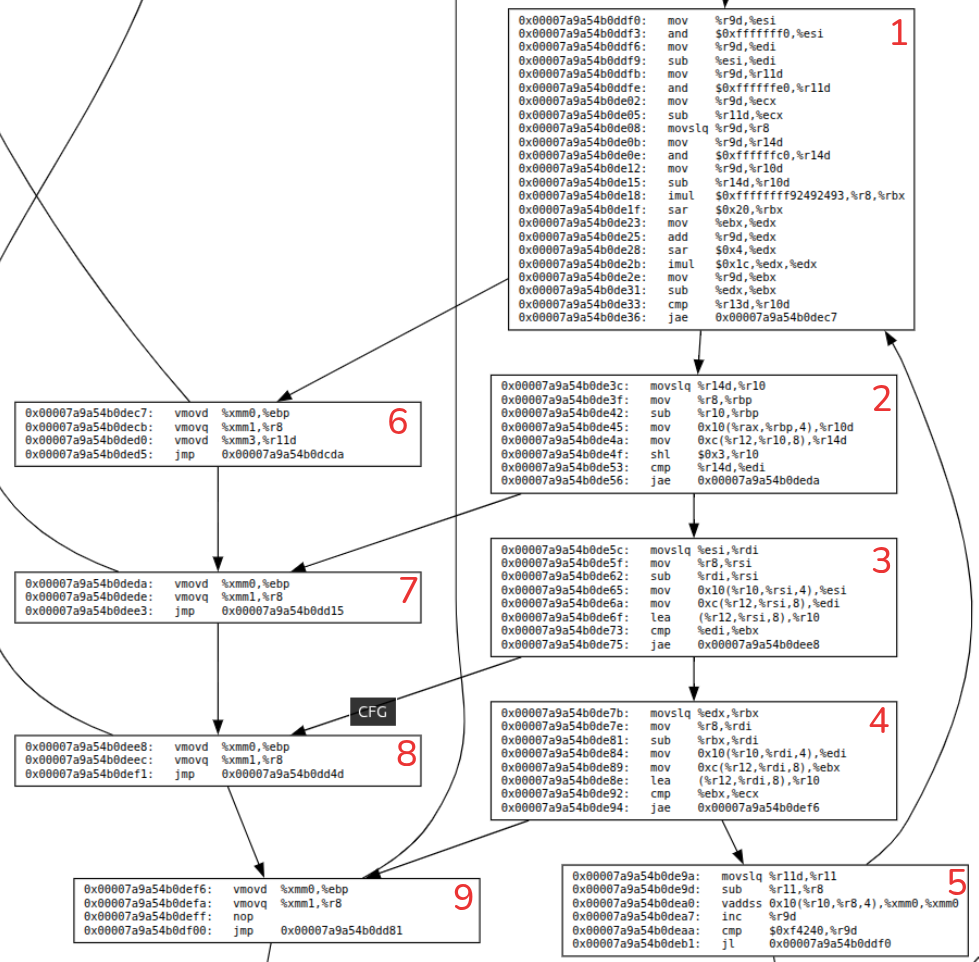
Few notes on above graph
- Notice the blocks - 1, 2, 3, 4. They seem to be calculating the indexes and accessing sub arrays.
- All these blocks have index-validations so when there is a validation failure, they branch to left side blocks - 6, 7, 8, 9.
- Block 5 is doing the real operation - access the element and add to sum variable.
A side-note on Java pointers and object layout
Compressed pointers
Even if we run a 64 bit JVM, by default, for small heap sizes (<32G) the references to objects are 32 bit. These are called compressed pointers. They help JVM lower the memory footprint for most applications (you can disable it too).
Compressing a pointer is as simple as shifting it left by 3 bits (shl) and expanding is multiplyng by 8 (or right shift 3 bits).
Conversion from JVM pointer to physical memory (or logical memory – lets be aware of segmentation and paging done by OS) address is done through
logical_addr = heap_base_ptr (usually r12) + pointer * 8
Object layout
JVM attaches a header to every java object for its management (GC, locking, typing etc). It looks as follows
offset  length (bit)    note
0x0     32              mark word
0x4     32              mark word
0x8     32              class word
0xc     32              loss due to alignment
0x10    .... other object fields ....
If the JVM knows that there is loss due to alignment for a type, 0xc can be used for storing fields.
You can read a lot more about this here - https://shipilev.net/jvm/objects-inside-out
Back to our assembly…
Let’s look at one of the intermediate block (which accesses a sub array at some level) to understand this assembly better
; essentially rsi = r8 - esi
; rsi is index of a sub array (you can look at the complete assembly)
0x00007a9a54b0de5c:   movslq %esi,%rdi
0x00007a9a54b0de5f:   mov    %r8,%rsi
0x00007a9a54b0de62:   sub    %rdi,%rsi

; copy the address of the sub-array's first element to esi
; r10 points to first element of parent array.
0x00007a9a54b0de65:   mov    0x10(%r10,%rsi,4),%esi

; get the array length (present at 0xc offset) and put it in edi
; note the decoding of the pointer to logical address here
0x00007a9a54b0de6a:   mov    0xc(%r12,%rsi,8),%edi

; load the address of the sub-array in to r10
0x00007a9a54b0de6f:   lea    (%r12,%rsi,8),%r10

; compare the index we are accessing (ebx) with length of the array (edi)
0x00007a9a54b0de73:   cmp    %edi,%ebx

; jump to block 8 (exception) if above or equal
0x00007a9a54b0de75:   jae    0x00007a9a54b0dee8
Too much overhead for just accessing an array element. What can be done?
First thing that strikes our mind is to get rid of compressed pointers. Let’s try that out first.
$ java -XX:-UseCompressedOops -jar target/benchmarks.jar
...

Result "com.mpataki.Tensor4DBenchmark.accessTest":
  130.186 ±(99.9%) 0.749 ops/s [Average]
  (min, avg, max) = (130.009, 130.186, 130.491), stdev = 0.195
  CI (99.9%): [129.437, 130.935] (assumes normal distribution)

Benchmark                      Mode  Cnt    Score   Error  Units
Tensor4DBenchmark.accessTest  thrpt    5  130.186 ± 0.749  ops/s
The numbers went down. What is going on? Did JIT generate more instructions this time? Let’s compare the compiled code stats. Full compilation results with -XX:-UseCompressedOops from my machine are here
# Stats of compiled method in JVM with -XX:-UseCompressedOops
Compiled method (c2) 482  961       4       com.mpataki.Tensor4DBenchmark::realTest (59 bytes)
 total in heap  [0x000076c734b0e108,0x000076c734b0e610] = 1288
 relocation     [0x000076c734b0e1e0,0x000076c734b0e218] = 56
 main code      [0x000076c734b0e220,0x000076c734b0e5e8] = 968  <============
 stub code      [0x000076c734b0e5e8,0x000076c734b0e600] = 24
 oops           [0x000076c734b0e600,0x000076c734b0e608] = 8
 metadata       [0x000076c734b0e608,0x000076c734b0e610] = 8
 immutable data [0x000076c5e0006c00,0x000076c5e0006de8] = 488
 dependencies   [0x000076c5e0006c00,0x000076c5e0006c08] = 8
 nul chk table  [0x000076c5e0006c08,0x000076c5e0006c60] = 88
 scopes pcs     [0x000076c5e0006c60,0x000076c5e0006d10] = 176
 scopes data    [0x000076c5e0006d10,0x000076c5e0006de8] = 216

# Stats of compiled method in JVM without any flags
Compiled method (c2) 487  950       4       com.mpataki.Tensor4DBenchmark::realTest (59 bytes)
 total in heap  [0x00007a9a54b0da08,0x00007a9a54b0dfb0] = 1448
 relocation     [0x00007a9a54b0dae0,0x00007a9a54b0db18] = 56
 main code      [0x00007a9a54b0db20,0x00007a9a54b0df88] = 1128 <============
 stub code      [0x00007a9a54b0df88,0x00007a9a54b0dfa0] = 24
 oops           [0x00007a9a54b0dfa0,0x00007a9a54b0dfa8] = 8
 metadata       [0x00007a9a54b0dfa8,0x00007a9a54b0dfb0] = 8
 immutable data [0x00007a9a0832f220,0x00007a9a0832f408] = 488
 dependencies   [0x00007a9a0832f220,0x00007a9a0832f228] = 8
 nul chk table  [0x00007a9a0832f228,0x00007a9a0832f280] = 88
 scopes pcs     [0x00007a9a0832f280,0x00007a9a0832f330] = 176
 scopes data    [0x00007a9a0832f330,0x00007a9a0832f408] = 216
Number of instructions have reduced (see main code) but that hasn’t improved the throughput.
Is this due to varying system load?
I ran the benchmark few times (w/ and w/o the flag -XX:-UseCompressedOops) for validation. These are the results.
=== compressed pointer ===
Tensor4DBenchmark.accessTest  thrpt    5  134.864 ± 1.269  ops/s
Tensor4DBenchmark.accessTest  thrpt    5  134.174 ± 4.505  ops/s
Tensor4DBenchmark.accessTest  thrpt    5  132.925 ± 3.045  ops/s

=== un-compressed pointer ===
Tensor4DBenchmark.accessTest  thrpt    5  127.246 ± 0.588  ops/s
Tensor4DBenchmark.accessTest  thrpt    5  132.426 ± 0.343  ops/s
Tensor4DBenchmark.accessTest  thrpt    5  131.920 ± 1.218  ops/s
Two points to note here
- The numbers slightly went down when we are using un-compressed pointer
- There is jitter in the benchmarking system. Even though numbers seem very nearby to distinguish, if you recall the loop in the
realTestmethod - it iterates for 1_000_000 times, so the smallest differences in above numbers should matter for us. How do we eliminate these differences?
Why performance decreased with un-compressed pointer?
I have no freaking clue. I need to experiment and figure it out. May be in subsequent episodes.
Jitter in the system
What can we do here? Is it the system load? Is our thread is time sharing CPU core with other tasks in the system or the thread is jumping between cores (getting scheduled on different cores)?
Experiment 1. taskset and nice
To isolate our benchmark from the system load, we can
- make our process high priority by setting its niceness to
-20 - set its processor affinity to few processors (it will run on only those CPU cores; aka pinning a task to processors)
Usually a JVM has many threads. In our application, the important ones are - 2-compiler threads (in tiered mode, its the minimum) and our main thread. So lets use 4 processors for pinning our threads. We can use the below command. (full output)
$ taskset -c 2-6 \
  nice -20 \
  java -jar ./target/benchmarks.jar

# results for 3 runs
(min, avg, max) = (130.509, 130.745, 131.182), stdev = 0.271
(min, avg, max) = (128.707, 130.467, 131.601), stdev = 1.075
(min, avg, max) = (129.288, 131.815, 132.836), stdev = 1.513
Results are inconsistent (look at min, max and stdev). Is our main task jumping between 4 processors? Let’s try with 2 processors. (full output)
$ taskset -c 5-6 nice -20 java -jar target/benchmarks.jar

# results for 3 runs
(min, avg, max) = (130.000, 130.394, 131.161), stdev = 0.455
(min, avg, max) = (127.208, 131.264, 135.267), stdev = 3.253
(min, avg, max) = (123.210, 124.443, 124.934), stdev = 0.699
Surprisingly the results are still inconsistent, there is still some jitter (see the stdev). We need to be sure our thread is running on a single processor all the time.
It’s time for `perf’
perf is a Linux tool which lets us monitor and record events (software & hardware) with their metadata. Two of the scheduler events which are interesting for us are sched_switch (triggered when scheduler switches a task) & sched_migrate_task (triggered when scheduler moves a task from one processor to other) (you can get info and the list of all events by looking at perf list).
$ sudo \
  taskset -c 2-6 \
  nice -20 \
  perf record -e sched:sched_switch,sched:sched_migrate_task \
  java -jar target/benchmarks.jar
Post this, we need to run below command to aggregate the stats (events are dumped in to a file named perf.data). In below output, 1st column is number of times our thread (task) was rescheduled, x/y in col 2 is TID/PID, and 3rd column is processor id (you can also download the perf.data file and from same dir, just run perf sched timehist).
$ perf sched timehist | grep com.mpataki | awk '{printf "%s %s\n", $3, $2}' | sort | uniq -c
Samples of sched_switch event do not have callchains.
    842 com.mpataki.Ten[123747/123693] [0002]
    205 com.mpataki.Ten[123747/123693] [0003]
    396 com.mpataki.Ten[123747/123693] [0004]
   1050 com.mpataki.Ten[123747/123693] [0005]
   1180 com.mpataki.Ten[123747/123693] [0006]
    671 com.mpataki.Ten[126541/126499] [0002]
    916 com.mpataki.Ten[126541/126499] [0003]
   1172 com.mpataki.Ten[126541/126499] [0004]
    640 com.mpataki.Ten[126541/126499] [0005]
    378 com.mpataki.Ten[126541/126499] [0006]
Were there any other processes on these processors?
Looking at the some entries of type sched_migrate_task tells us that other processes were scheduled on these processors.
$ perf script | grep sched_migrate_task
Thread-9  126501 [004]  5141.499049: sched:sched_migrate_task: comm=Service Thread pid=123635 prio=139 orig_cpu=5 dest_cpu=6
java  123612 [003]  5141.522494: sched:sched_migrate_task: comm=chrome pid=9037 prio=120 orig_cpu=3 dest_cpu=0
java  123612 [003]  5141.540684: sched:sched_migrate_task: comm=VM Periodic Tas pid=123620 prio=139 orig_cpu=3 dest_cpu=4
java  123612 [003]  5141.543664: sched:sched_migrate_task: comm=kworker/u48:1 pid=63632 prio=120 orig_cpu=0 dest_cpu=1
So our assumption was incorrect. Setting the process affinity will not make those processors exclusive to this process. It’s just tells Linux to schedule the process always on these CPUs.
What would you do if you wanted Linux to never schedule other processes on these processors?
In the next episode of this series, we will see the answer to this and dig further deep into reducing the noise on the bechmarking machine. Also I will also try to introduce you to a surprise which stumped me while experimenting with this benchmark.
Steps to build hsdis
-
Build JDK. Steps here, you need to change a little - https://github.com/openjdk/jdk24u/blob/master/doc/building.md
- Download binutils source and keep them somewhere and provide path while configuring
bash configure --with-hsdis=binutils --with-binutils-src=/path/to/binutils-2.45.1 -
make
- Copy the
.sofile to the$JAVA_HOME/lib/server