Part 4: CPU temperature, frequency and MSRs
8 mins readJanuary 17, 2026
linux
performance
intel
benchmark
Yo! Welcome to part 4 of this series.
For those who landed here directly, this is the part 4 of the series - Taking JVM on a performance ride (4D tensor). I suggest you to take a look at all the previous posts before reading this.
In the last part of this series, we fixed the jitter in the system and made it almost stable. But the numbers were still not same across run, so I decided to explore ways to fix it. Remember last time I mentioned about me and my brother having a weird theory about it? Here we go…
From my observation of GPUs, its performance (frequency) varies with temperature. So I wanted to see if core 10-11 are executing on their fullest. Linux exposes the current frequency through the sysfs. These were my readings while executing the benchmark.
$ head /sys/devices/system/cpu/cpufreq/policy*/scaling_cur_freq;
==> /sys/devices/system/cpu/cpufreq/policy0/scaling_cur_freq <==
2600062

==> /sys/devices/system/cpu/cpufreq/policy10/scaling_cur_freq <==
800000

==> /sys/devices/system/cpu/cpufreq/policy11/scaling_cur_freq <==
800000

==> /sys/devices/system/cpu/cpufreq/policy1/scaling_cur_freq <==
2600003

==> /sys/devices/system/cpu/cpufreq/policy2/scaling_cur_freq <==
2600005

==> /sys/devices/system/cpu/cpufreq/policy3/scaling_cur_freq <==
2600018

==> /sys/devices/system/cpu/cpufreq/policy4/scaling_cur_freq <==
2600021

==> /sys/devices/system/cpu/cpufreq/policy5/scaling_cur_freq <==
2600021

==> /sys/devices/system/cpu/cpufreq/policy6/scaling_cur_freq <==
800000

==> /sys/devices/system/cpu/cpufreq/policy7/scaling_cur_freq <==
800000

==> /sys/devices/system/cpu/cpufreq/policy8/scaling_cur_freq <==
800000

==> /sys/devices/system/cpu/cpufreq/policy9/scaling_cur_freq <==
800000
My CPU’s max frequency is 2.6GHz (machine details), but then why are core 10,11 running on 800MHz (minimum)!!?
Our weird reasoning : It’s possible that the OS (the thermal mgmt driver) is underclocking the CPU (for me the reasoning came from observation of GPU behavior, but for my brother it was due to some subatomic level entropy)
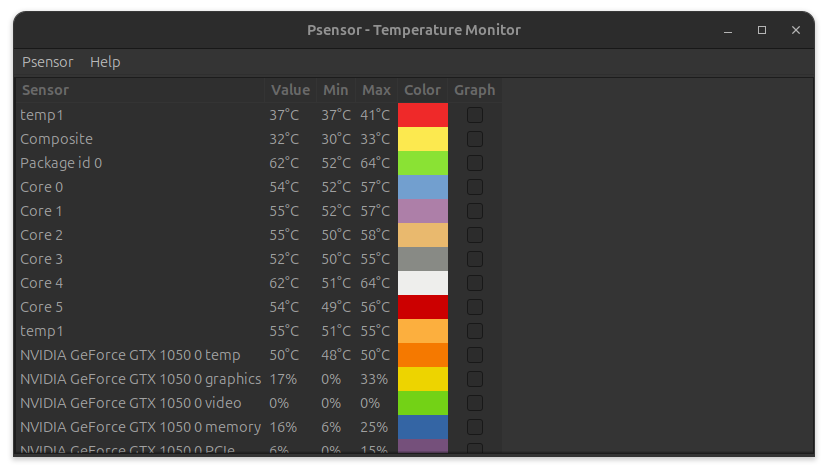
We decided to monitor CPU temperature using psensor (Linux). The temperature was indeed high ~64° C. (below image was not captured live, but it exists here to show the processor temperature can vary in the same package)
My options
- Make the CPU cooler
- Make sure air flows in to vents
- Clean the air vents
- Some cooling arrangement, like
- fan in the bottom
- smth like cooling with ice LoL 🤣
- Shutdown for some time, run benchmarks.
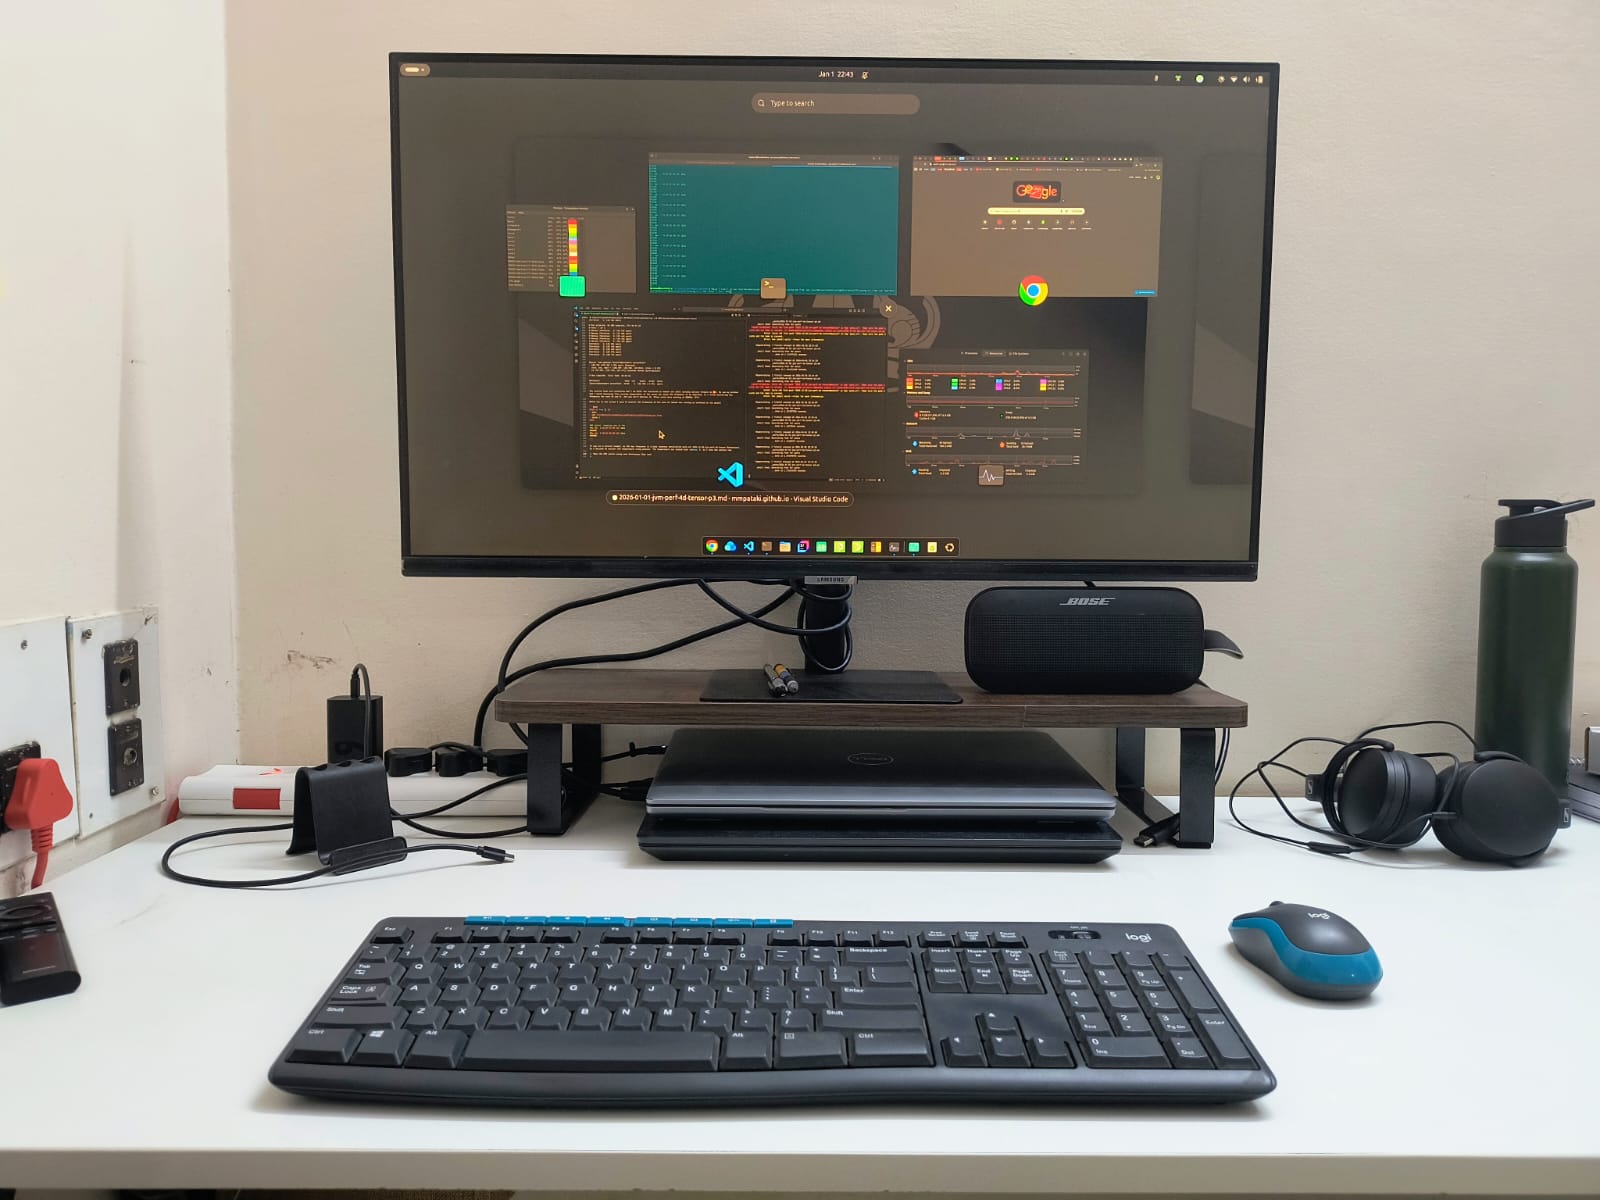
Since I keep my laptops as shown below (black one is running the benchmark) (flexing ofc 😎) I decided to cool the laptop (pull it out, keep it upside down as its vents are below (Stranger Things)) and give it a try.
Putting the laptop upside down brought the temp down by few degrees, but it didn’t solve my processor frequency problem. So I went on to read about CPU Performance Scaling in Linux.
CPU Performance scaling in brief
There exists a subsystem named cpufreq in Linux which tries to manage the processor performance states. It’s divided into three parts.
- Core - common functionality
- Scaling driver - talking to device to set frequency, call backs for h/w interrupts to record frequency
- Scaling governer - userspace algorithm to make decisions
For Intel devices OS vendors package an implementation named intel_pstate which doesn’t have a scaling governer. The driver itself makes decisions. There are different modes intel_pstate can be in, based on (whether it’s started in active or passive mode + availability of h/w support)
- Active + HWP : Driver allows the h/w to make decision (but hints whether it should focus on performance / powersave)
- Active - HWP : Driver gets the current utilization from the H/w interrupts and decides.
- Performance : CPUs always run on highest p-state
- Powersave : Driver decides the frequency
- Passive : Driver works with generic scaling governers to decide the p-state.
If you are interested, the source code for
intel_pstateandcpufreqare at
For my laptop, the intel_pstate was active with HWP support but policy was powersave.
$ cat /sys/devices/system/cpu/intel_pstate/status
active

$ lscpu | grep hwp
Flags:  ... hwp hwp_notify hwp_act_window hwp_epp ...

$ cat /sys/devices/system/cpu/cpufreq/policy*/scaling_governor | sort | uniq
powersave
I tried settings the policy to performance but it didn’t change anything. The numbers remained the same.
$ sudo cpupower frequency-set -g performance
Setting cpu: 0
...
Setting cpu: 10
Setting cpu: 11

$ sudo cpupower frequency-info
analyzing CPU 1:
  driver: intel_pstate
  CPUs which run at the same hardware frequency: 1
  CPUs which need to have their frequency coordinated by software: 1
  energy performance preference: performance
  hardware limits: 800 MHz - 2.60 GHz
  available cpufreq governors: performance powersave
  current policy: frequency should be within 800 MHz and 2.60 GHz.
                  The governor "performance" may decide which speed to use
                  within this range.
  current CPU frequency: 2.60 GHz (asserted by call to kernel)
  boost state support:
    Supported: no
    Active: no
MSR (Model specific registers)
I was doubtful of these counters now since they are updated by the driver when there are hwp interrupts. Turns out there is a way we can directly query the CPU for its p-state using the rdmsr (read model specific register) instruction.
The MSRs required here are APERF (0xE8 - actual performance) and MPERF (0xE7 - maximum performance). Linux exposes all per-CPU MSRs thru a file /dev/cpu/<cpuid>/msr which can be read using std io APIs. Open the file, seek to the position equal to MSR number and read a word from there. Note that, rdmsr requires elevated privileges and also there are tools to read and interpret the above mentioned MSRs.
# load the msr kernel module
$ sudo modprobe msr

# check whether it's loaded
$ lsmod | grep msr
msr                    12288  0

# install the tools
$ sudo apt install cpufrequtils

# print the actual performance of core 11
$ sudo cpufreq-aperf -c 11
CPU Average freq(KHz)  Time in C0      Time in Cx      C0 percentage
11  2600000            00 sec 000 ms   00 sec 999 ms   00
So the readings from /sys were incorrect. The problem turned out to be the isolcpus cmdline option we passed to the kernel (this needs a exploration).
Ok.. that was enough speculation. In the next part of this series, we will do some systematic investigation of h/w on why things are not the way we expect them to be.